A companion to Six Percent and The Margin Trap
SWISS reported FY2025 results today. Revenue fell 2.5% to CHF 5.50 billion. Adjusted EBIT fell 26.6% to CHF 502 million. The operating margin compressed from 12.1% to 9.1%.1
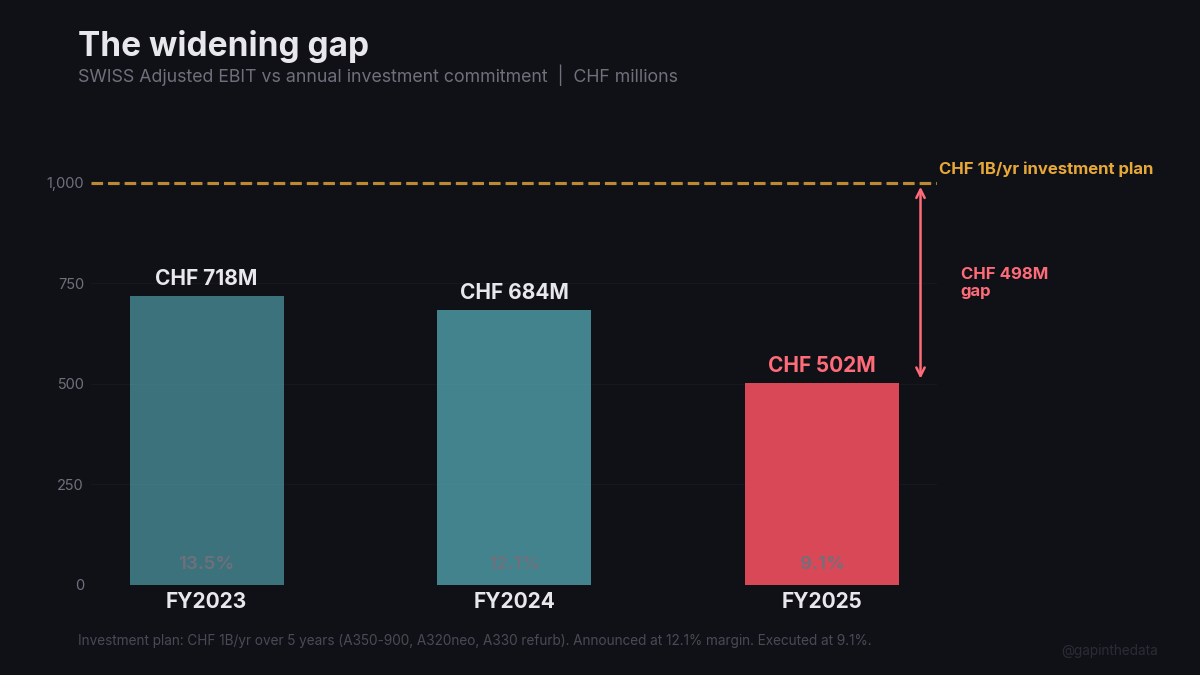
Two years ago, SWISS posted a record CHF 718.5 million EBIT at a 13.5% margin.2 The airline has since grown passengers from 16.5 million to 18.1 million, added over 13,000 annual flights, and expanded available seat-kilometres by 12%.1 2 Every operational metric expanded. The only thing that contracted was profit.
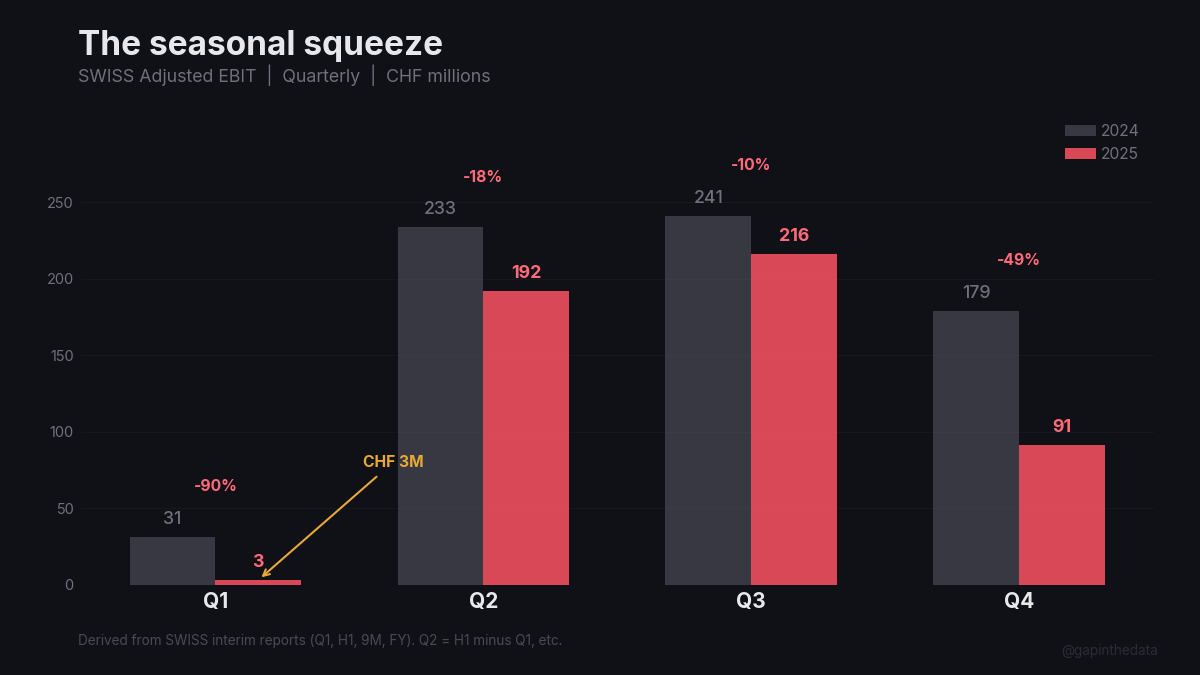
The quarterly cadence makes the trajectory concrete. Q1 2025: CHF 3 million EBIT, down 90% from CHF 31 million a year prior. Q4 2025: CHF 91 million, down 49% from CHF 179 million.1 The peak summer months (Q2-Q3) held up better, but the seasonality is compressing into a narrower window. Outside of June through September, SWISS is barely profitable.
SWISS is not an outlier. It is a data point in a pattern visible across every major carrier that has reported.
I. The ledger
The major US carriers filed FY2025 annual reports through February 2026. Ryanair’s fiscal year ends in March. The figures below are extracted from SEC CompanyFacts XBRL: unedited numeric facts from 10-K and 20-F filings.
| Airline | Revenue | Op Inc | Op Margin | Prior Year | Change |
|---|---|---|---|---|---|
| Ryanair | €13.9B | €1.56B | 11.2% | 15.3% | −4.1pp |
| Delta | $63.4B | $5.82B | 9.2% | 9.7% | −0.5pp |
| United | $59.1B | $4.71B | 8.0% | 8.9% | −0.9pp |
| American | $54.6B | $1.47B | 2.7% | 4.8% | −2.1pp |
| Southwest | $28.1B | $0.43B | 1.5% | 1.2% | +0.3pp |
| JetBlue | $9.1B | $(0.37B) | −4.1% | −7.4% | +3.3pp |
| SWISS | CHF 5.5B | CHF 0.50B | 9.1% | 12.1% | −3.0pp |
Source: SEC CompanyFacts XBRL (US carriers, Ryanair 20-F); SWISS newsroom.3
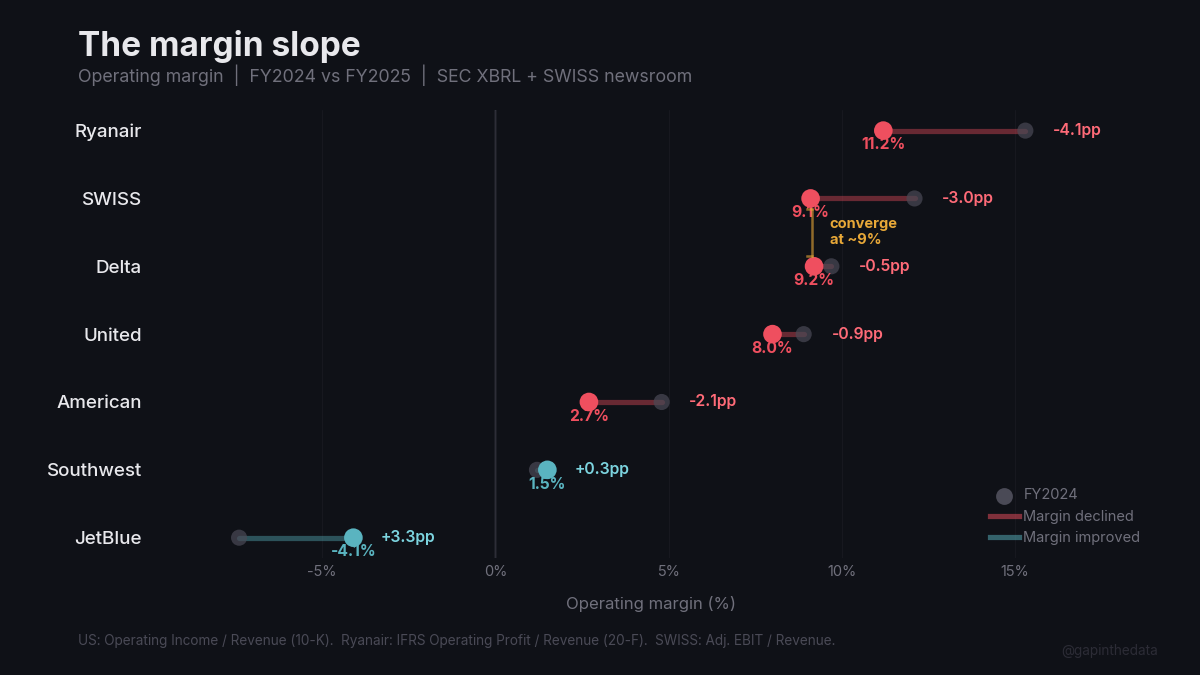
Five of seven carriers compressed margins. Ryanair, Europe’s most profitable airline, saw the sharpest decline: 4.1 percentage points in a single year, from 15.3% to 11.2%, driven by operating costs rising 8.9% on 3.8% revenue growth.3 Delta and United, the premium leaders documented in Six Percent, held near 8–9% but trended down. American’s margin nearly halved. Southwest and JetBlue improved, but from bases so low that improvement still left them marginal or loss-making. Spirit filed for Chapter 11 after posting a $1.1 billion operating loss.4
SWISS, at 9.1%, now sits within a percentage point of Delta’s 9.2%.1 3 Two years ago, SWISS operated four points above Delta. Delta held. SWISS fell.
Revenue growth was uniformly modest. Delta grew 2.8%. United grew 3.5%. American managed 0.8%. SWISS contracted 2.5%.1 3 No carrier in this sample grew revenue faster than 4%. The post-pandemic yield surge has normalised.
II. The cost ratchet
Revenue is flat. Costs are not.
SWISS identified the drivers explicitly: personnel costs rose from new hires and salary increases; air navigation fees increased disproportionately; maintenance costs remained elevated due to engine constraints; a companywide cost reduction programme was launched in response.1 Fuel was the only reprieve, running below prior year. It was not enough.
The drivers are structural and industry-wide.
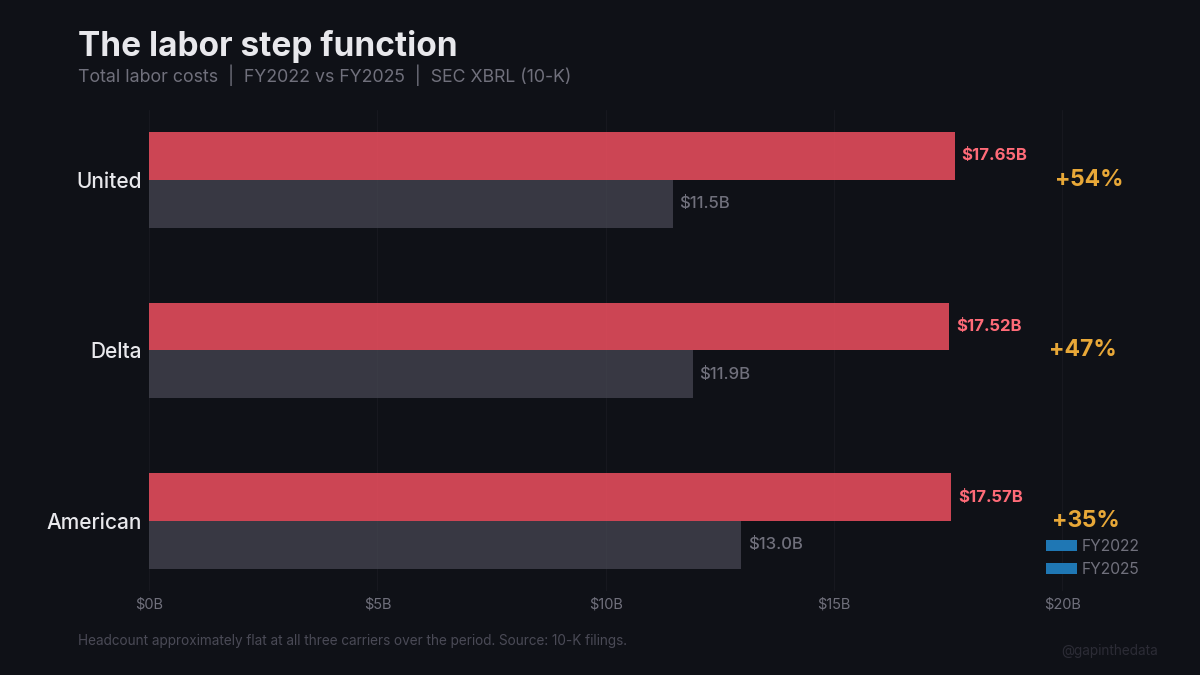
Labour. Post-pandemic contracts repriced cockpit and cabin crew globally. The SEC filings make the step-up visible: Delta’s total labor costs rose 47% in three years to $17.5 billion, with headcount flat. United’s rose 54%. American’s rose 35%. Labor’s share of total operating costs increased 4 to 6 percentage points at each carrier.5 Lufthansa Group, SWISS’s parent, settled multi-year pilot agreements adding several hundred million euros annually across the group. These costs are step functions. Each contract resets the baseline for the next.
Maintenance. The engine crisis documented in What Safran Can’t Fix is a supply-side problem for Airbus and a cost problem for every operator of GTF-powered aircraft. SWISS reported engine shortages as a direct constraint on growth in 2025, alongside cockpit crew shortages.1 Air France-KLM confirmed 21% of its A220 fleet grounded and 42% requiring inspections.6 Grounded aircraft generate zero revenue while requiring AOG maintenance spending and wet-lease substitutions, often at twice the per-seat cost of owned capacity.
Infrastructure. Airport charges, air navigation fees, and ground handling costs have risen faster than CPI across European operations since 2023. SWISS cited disproportionate air navigation fee increases specifically.1 These fees are set by national authorities with limited competitive constraint. They are de facto taxes on capacity growth.
The arithmetic is visible in SWISS’s unit economics. Revenue per passenger declined approximately 3% year-over-year: CHF 304 versus CHF 313.7 EBIT per passenger dropped 27%: CHF 27.7 versus CHF 38.0.7 More passengers, each contributing less profit, each costing more to serve.
III. What it means for the backlog
Airbus’s 8,658-aircraft commercial backlog at year-end 2025 represents approximately a decade of production.8 The customers behind that backlog are the airlines documented above. Their margins are compressing.
Demand is fine. Load factors remain above 83% at SWISS.1 Passengers are flying. Unit economics are the constraint: the cost of serving each passenger is rising faster than the fare each passenger pays.
When customers’ margins compress, three things follow.
Delivery deferrals. Airlines with deteriorating cash flow seek to push delivery slots. This is already visible. United removed 45 A350-900s from its fleet plans. American deferred A321XLR deliveries. Lufthansa Group has repeatedly adjusted widebody delivery timelines. The backlog number stays constant; the cash conversion timeline extends.
Price resistance. Airbus has raised catalogue prices and escalation clauses annually. The margin trap attributes Airbus’s per-aircraft EBIT decline primarily to programme mix (A220 losses, A350 ramp costs, Spirit integration). But the demand-side pressure is real: airlines with compressing margins negotiate harder on final pricing, and the narrowbody backlog’s conversion to cash depends on customers whose unit economics are deteriorating.
The capex–earnings gap. SWISS is investing CHF 1 billion per year over five years: A350-900s with the new SWISS Senses cabin, A320neo family deliveries, A330 refurbishment.1 2 This investment plan was announced when the margin was 12.1%. It is being executed at 9.1%. The gap between the plan’s assumptions and the plan’s funding is widening with every quarterly report.
IV. The engine tax
The engine crisis connects both sides of the transaction. It constrains Airbus deliveries and inflates airline costs.
SWISS received its first A350-900 in H2 2025 and continued taking A320neo deliveries.1 Each new aircraft should expand capacity and lower unit costs through fleet modernisation. But the fleet being replaced includes aircraft whose engines are in crisis. The PW1500G engines powering the A220 fleet have grounded roughly 22% of the global fleet, with turnaround times stretching to 300 days.6 The PW1100G engines on A320neos face their own inspection mandates.
The cycle is self-reinforcing. Airlines cannot fly grounded aircraft. They pay for engine inspections and replacements. They lease substitution capacity at premium rates. They wait for new aircraft that Airbus cannot deliver because the same engine manufacturers cannot supply new engines. Lost revenue at one end, constrained growth at the other, rising costs at every step between.
The premium reconfiguration documented in Six Percent was the industry’s attempt to outrun this cost structure by extracting more revenue per seat. Delta and United have executed it better than anyone, and their operating margins still compressed. For carriers without a premium moat (American at 2.7%, Southwest at 1.5%, JetBlue still negative), the buffer is thinner and the timeline shorter.
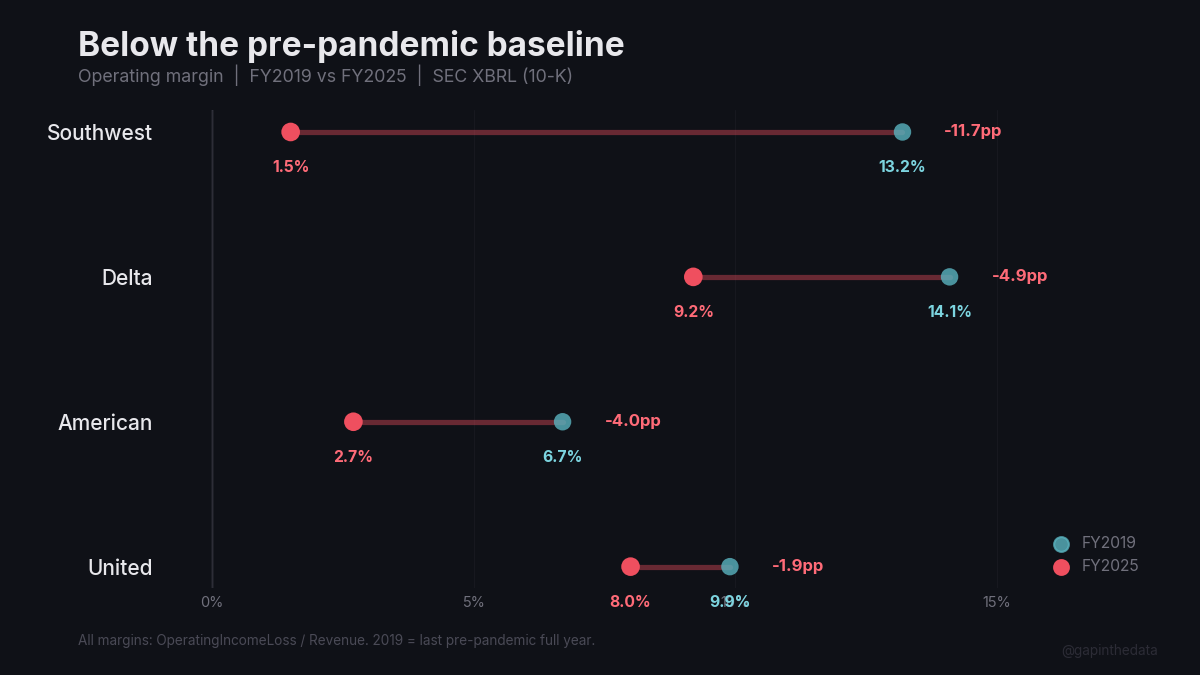
A reasonable objection: the 2023 margins were the anomaly. The post-pandemic yield surge was always temporary. What we are watching may be reversion to airline-industry normal.
The pre-pandemic data does not support that reading. In FY2019, Delta earned a 14.1% operating margin. United earned 9.9%. American earned 6.7%. Southwest earned 13.2%.9 Every one of those carriers now operates below its 2019 level: Delta by 4.9 points, United by 1.9, American by 4.0, Southwest by 11.7. The 2023 peak was a sugar high. The current trough is below the pre-pandemic baseline.
The cost ratchet documented above explains why. The labor step-up of 35–54% in three years, the infrastructure fee increases, the engine maintenance mandates: these costs were layered on during the sugar high and remain when the sugar fades. Nine is worse than thirteen. The question is whether nine is stable, or whether the cost trajectory points lower while revenue growth has already stalled.
SWISS’s margin went from 13.5% to 9.1% in two years. The rest of the industry is on the same slope, separated only by velocity.
Footnotes
1 SWISS, “SWISS posts an operating result of CHF 502 million for 2025,” March 6, 2026. Revenue CHF 5.50B (−2.5%); Adjusted EBIT CHF 502.2M (−26.6%); passengers 18.1M; flights >143,000; ASK +1.5%; RPK +0.5%; load factor 83.3%; punctuality 69.3%. Quarterly EBIT derived from interim reports: Q1 CHF 3M, Q2 CHF 192M (H1 − Q1), Q3 CHF 216M (9M − H1), Q4 CHF 91M (FY − 9M). Cost drivers: personnel costs up (new hires, salary increases), air navigation fees rising disproportionately, maintenance costs elevated, engine and cockpit crew shortages constraining growth. Investment: CHF 1B/year over 5 years; first A350-900 delivered H2 2025; A320neo deliveries ongoing. See also: Q1, H1, 9M.
2 SWISS, “SWISS posts record CHF 718 million operating result for 2023,” March 7, 2024. Revenue CHF 5.3B; Adjusted EBIT CHF 718.5M; margin 13.5%; passengers 16.5M; flights >130,000; capacity at 87% of pre-pandemic. SWISS, “SWISS achieves its second-best ever operating result of CHF 684 million for the 2024 financial year,” March 6, 2025. Revenue CHF 5.64B; Adjusted EBIT CHF 683.8M; margin 12.1%; passengers ~18.0M; flights >142,000; capacity at ~95% of pre-pandemic.
3 SEC CompanyFacts XBRL extracts. US carriers: 10-K filings for FY2025 (calendar year); revenue: RevenueFromContractWithCustomerExcludingAssessedTax; operating income: OperatingIncomeLoss. Filed dates: Southwest 2026-02-05, Delta 2026-02-11, United 2026-02-12, JetBlue 2026-02-12, American 2026-02-18. All US figures USD. Ryanair: 20-F filing for FY ending March 2025, filed 2025-05-19; revenue: ifrs-full:Revenue (€13,948.5M); operating profit: ifrs-full:ProfitLossFromOperatingActivities (€1,558.0M); prior year €2,060.7M on €13,443.8M revenue. All EUR. Full dataset: data/financial_statements_ground_truth/.
4 Spirit Aviation Holdings, 10-K filed March 3, 2025. FY2024 operating loss $1,105M; net loss $1,229M. Revenue $4.91B. Chapter 11 filing November 2024. Source: data/financial_statements_ground_truth/spirit_airlines.md.
5 US carrier labor costs from SEC XBRL (us-gaap:LaborAndRelatedExpense, 10-K filings). Delta: $11,902M (FY2022) → $17,520M (FY2025), +47%, headcount flat at ~103,000; labor as % of total operating costs: 25.4% → 30.4%. United: $11,466M → $17,647M, +54%; labor share: 26.9% → 32.5%. American: $12,972M → $17,566M, +35%; labor share: 27.4% → 33.0%. The step-ups reflect post-pandemic pilot contracts: Delta (ratified May 2023, 34% cumulative increase over 4 years), United (ratified March 2024, ~$10B total value), American (ratified November 2023, comparable terms). Pilot-specific terms from airline press releases; aggregate labor data from SEC filings. Lufthansa Group: multi-year pilot agreement with Vereinigung Cockpit.
6 Air France-KLM FY2025 results coverage: 21% of A220 fleet grounded, 42% requiring PW1500G inspections. Global A220 fleet: ~22% grounded, turnaround times ~300 days. Sources: The Margin Trap footnote 12; Lara News; airline investor presentations.
7 Author’s calculations from SWISS reported data. FY2025: CHF 5,500M revenue / 18.1M passengers = CHF 304 per passenger; CHF 502.2M EBIT / 18.1M = CHF 27.7 per passenger. FY2024: CHF 5,640M / 18.0M = CHF 313; CHF 683.8M / 18.0M = CHF 38.0. Revenue per passenger: −3.0%. EBIT per passenger: −27.0%.
8 Airbus, FY2025 results, February 19, 2026. Commercial backlog: 8,658 aircraft. At ~793 deliveries per year (FY2025 actual), backlog represents approximately 10.9 years of production. Source: Airbus press release.
9 FY2019 operating margins from SEC CompanyFacts XBRL (10-K filings, calendar year 2019). Delta: $6,618M / $47,007M = 14.1%. United: $4,301M / $43,259M = 9.9%. American: $3,065M / $45,768M = 6.7%. Southwest: $2,957M / $22,428M = 13.2%. Revenue concept: RevenueFromContractWithCustomerExcludingAssessedTax; operating income: OperatingIncomeLoss. Full dataset: data/financial_statements_ground_truth/.