A companion to Three Chokepoints, Frozen Pots, and More Passengers, Less Profit
Updated March 10 with price data, diplomatic developments, and corrections.
G7 finance ministers met this afternoon to discuss a coordinated release from strategic petroleum reserves. The number under discussion was 300 to 400 million barrels. They declined. French Finance Minister Roland Lescure, chairing the session, told reporters: “We are not there yet."1 Energy ministers will reconvene Tuesday. Brent crude hit $119.50 this morning, while WTI posted the largest weekly gain in the history of the futures contract.34 The price pulled back to approximately $103 after President Macron called the reserves “an envisaged option."2 82
The buffer the market was pricing in has not been deployed. And even if the G7 eventually deploys it, the physics limit what it can achieve. Reserves are measured in barrels. Shortfalls are measured in barrels per day. The unit mismatch is the central constraint.
I. The shortfall
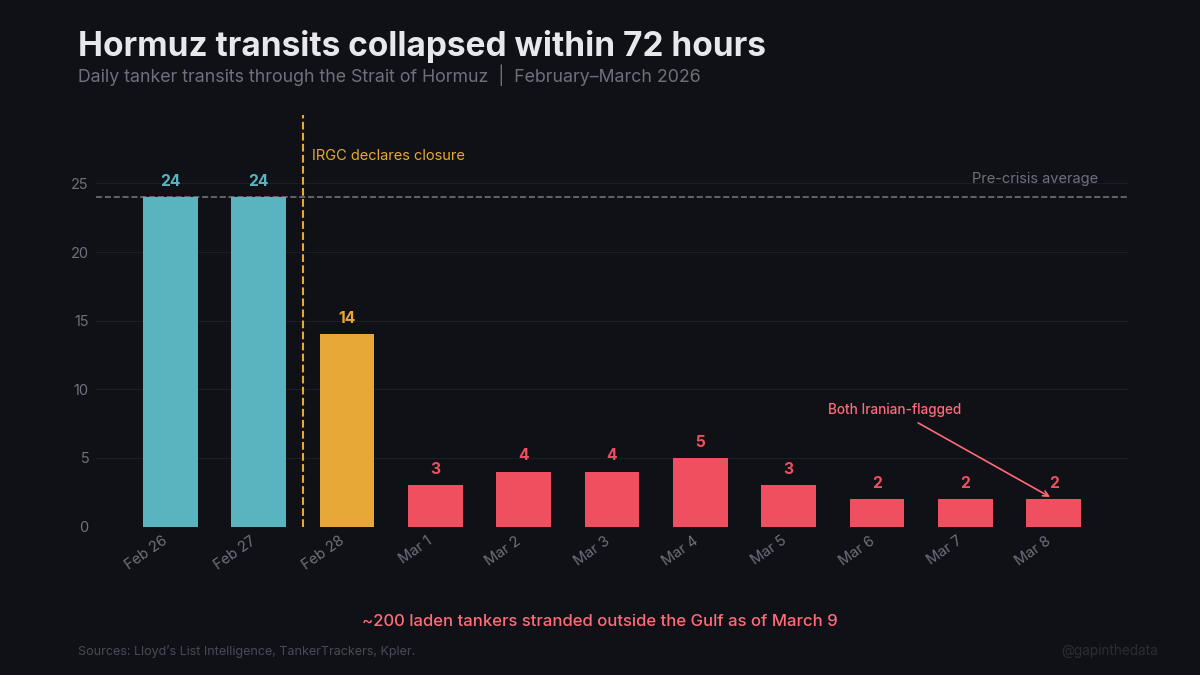
The Strait of Hormuz handles approximately 20 million barrels per day of crude oil, condensate, and petroleum products, roughly 20% of global consumption.3 The IRGC declared it closed on February 28.4 Three of the largest marine insurers, Gard, Skuld, and NorthStandard, withdrew war risk cover effective March 5, rather than repricing it.5 War risk premiums for the few remaining underwriters rose to 1% of vessel value. Approximately 1,000 ships are anchored or sheltering outside the Gulf.96 A strait does not need to be mined to be closed. It needs to be uninsurable.
The production at risk:
| Country | Production (M bbl/d) | Hormuz Dependent |
|---|---|---|
| Saudi Arabia | 10.1 | ~65% |
| Iraq | 4.1 | ~90% (southern Basra exports) |
| UAE | 3.38 | ~95% |
| Kuwait | 2.58 | ~100% |
| Iran | 3.13 | ~100% |
| Qatar | 0.6 | ~100% |
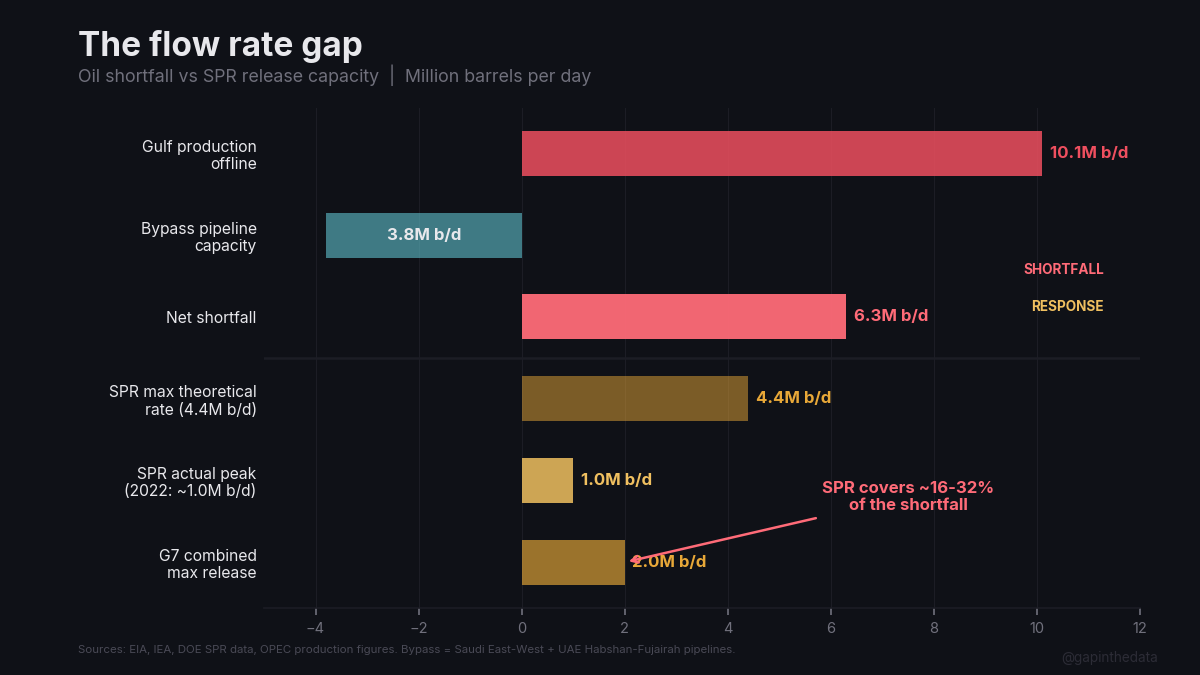
Two bypass pipelines exist. Saudi Arabia’s East-West Pipeline routes crude from Abqaiq to Yanbu on the Red Sea at roughly 2.5 million barrels per day of spare capacity, built during the 1980s Tanker War for exactly this scenario.6 In the first days of March, Yanbu loadings averaged 2.5 million barrels per day, up from 786,000 in February. The bypass is already at capacity.97 The UAE’s Habshan-Fujairah pipeline carries 1.5 million barrels per day to the Gulf of Oman, though Fujairah sits close enough to the Strait that its approaches remain contested.7 Combined usable bypass capacity: approximately 3.5 to 4.2 million barrels per day. Less than 20% of normal Hormuz flows. Neither pipeline handles refined products, and no bypass exists for LNG.8
The standard rebuttal is OPEC+ spare capacity: roughly 5 million barrels per day on paper. But the spare capacity sits behind the same Strait. Saudi Arabia’s 12 million barrel per day production ceiling has never been tested, and every additional barrel still needs a pipeline or tanker to reach a customer. Non-Gulf OPEC members are structurally unable to surge: Nigeria pumps 700,000 barrels per day below quota due to pipeline theft, Angola’s fields are in decline, Libya remains politically fragmented.77 On March 1, OPEC+ agreed to raise output by 206,000 barrels per day, roughly 2% of the shortfall.78
Tanker transits through the Strait fell from 24 per day to 3 within 72 hours, an 86% reduction.83
The net shortfall, production that cannot reach global markets, is conservatively 6 to 10 million barrels per day. There is no precedent for a disruption at this scale.
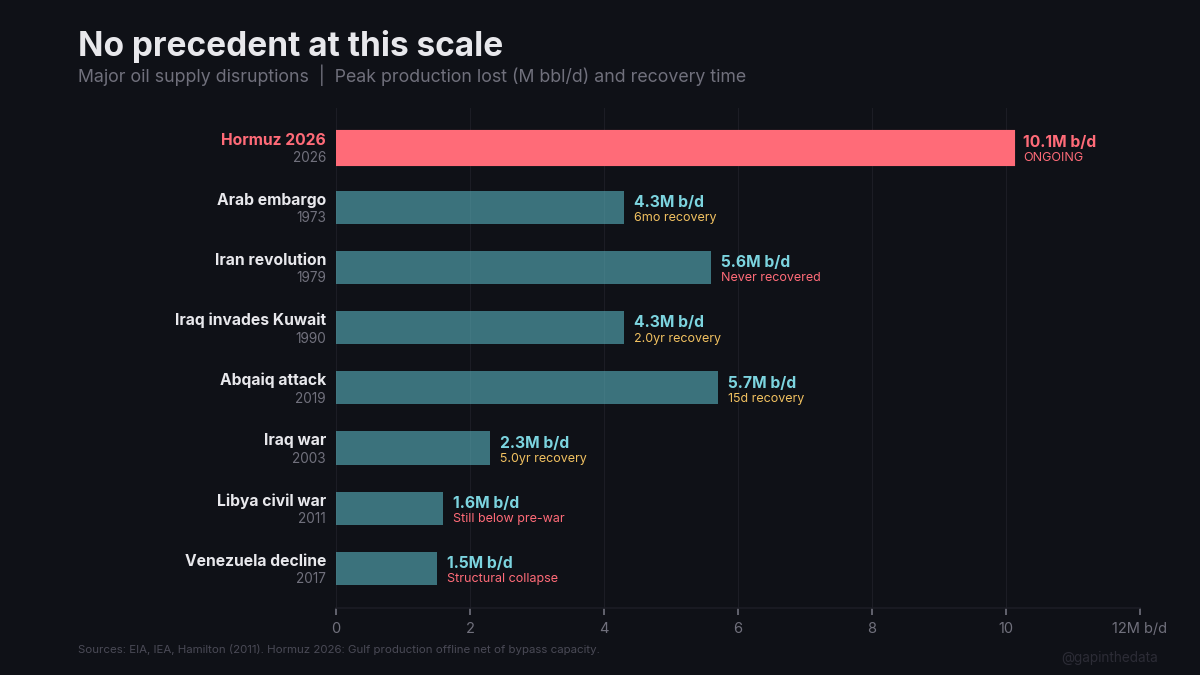
The 1973 Arab embargo removed 4.3 million barrels per day and quadrupled oil prices.9 The 1979 Iranian revolution took 5.6 million offline and nearly tripled them.10 The 2019 Abqaiq attack knocked out 5.7 million barrels per day, and Saudi Aramco restored production in two weeks because the damage was limited to stabilisation equipment and the government was stable and motivated to recover.11
At the upper end of the range, the current crisis is more than twice the 1973 embargo. Most of the infrastructure is blocked rather than damaged, though Saudi Arabia’s Ras Tanura refinery, the Kingdom’s largest at 550,000 barrels per day, shut down after debris from an intercepted Iranian drone caused a fire.73 Even a partially intercepted attack took out 550,000 barrels per day of refining capacity. On March 8, Israel struck Iranian oil infrastructure for the first time: storage tanks at the Shahr-e Rey refinery complex south of Tehran, oil depots in Karaj and Shahran, and warehouses across the capital. Toxic black smoke engulfed a city of 10 million. Iran’s IRGC retaliated by striking Israel’s Haifa refinery.84 The conflict is no longer merely blocking oil flows; it is destroying the infrastructure.
The government that controls the blockade, Iran’s, has been decapitated.12 The Provisional Leadership Council’s authority over IRGC naval forces is unclear. The historical pattern is unambiguous: when political authority over infrastructure is contested, recovery takes years.13 Iran never recovered from 1979. Libya remains below pre-war levels. Iraq took five years to reach pre-war production after 2003, with insurgent sabotage extending timelines at every stage.
II. The buffer
The G7’s communiqué said members “stand ready to take necessary measures, including to support global supply of energy such as stockpile release."85 IEA Executive Director Fatih Birol, who participated in the meeting, said on March 6 that “there are no plans for a collective action at this stage” and that “there is a huge surplus in the market."86 By Monday, his tone shifted: “Challenges to transit through the Strait of Hormuz and curtailments in oil production are posing significant and growing risks to global oil markets."87 His position reversed in three days, and yet the IEA has coordinated only five collective actions in its 50-year history.
Assume they act Tuesday. Take the upper end of the range: four hundred million barrels divided by 10 million barrels per day equals 40 days. At the lower end, 300 million, it is 30. This is the arithmetic the headline invites. It is also incomplete.
The constraint is the flow rate, not the stockpile size: how fast oil can be physically extracted from storage, moved through pipelines, and delivered to refineries.
The US Strategic Petroleum Reserve, the world’s largest government-controlled oil stockpile at roughly 395 to 415 million barrels, stores crude in underground salt caverns along the Gulf Coast.14 Drawing oil requires injecting water to displace the crude, a process constrained by cavern geometry, brine disposal capacity, and pipeline connections to nearby refineries.
The design maximum drawdown rate is 4.4 million barrels per day; actual current capability is closer to 4.2 million after cavern degradation.15 The 2022 release, the largest in SPR history, authorised 180 million barrels over six months, an implied rate of 1 million barrels per day. The peak month (June 2022) nearly hit that target: roughly 30 million barrels drawn, or about 1 million barrels per day.16 No other month came close. The average across the seven-month release was approximately 780,000 barrels per day.17 The peak single week delivered 8.4 million barrels, or 1.2 million barrels per day for seven days, then slower for the next three weeks.
The gap between theoretical and actual is physics, not bureaucratic delay. Only two of the SPR’s four storage sites are fully maintained for rapid drawdown.18 The pipeline network connecting caverns to refineries has finite throughput. From presidential authorisation to first oil reaching a refinery: 13 days minimum.19
The other G7 reserves face worse constraints. Japan holds roughly 440 million barrels but has never tested large-scale drawdown.20 Germany relies substantially on industry-held stocks dispersed across commercial storage sites with no unified drawdown mechanism.21 Canada has no government-held strategic reserve at all.22 The United Kingdom holds no government-owned stockpile, relying instead on an industry obligation.23
Combined G7 maximum release rate: approximately 1.5 to 2 million barrels per day. Against a 6 to 10 million barrel per day shortfall, that covers 15 to 33%.
The 2022 SPR release moderated oil prices from a peak of $128 to the $80 to $100 range over several months.24 The supply loss it was addressing, the impact of Russia sanctions, was roughly 1 to 2 million barrels per day.25 The current shortfall is three to ten times larger. Goldman Sachs calls it “a shock 17 times larger than the peak impact from Russia’s 2022 invasion."74 The reserve release that worked against a 1.5 million barrel per day loss has not been authorised against a 10 million barrel per day loss. And even if it were, the physics would be the same. Only the denominator would change.
III. The restart problem
Assume the best case: a ceasefire is reached, the military threat lifts, and insurance markets reopen. How long before Gulf oil production reaches global markets?
A complex refinery is a sequential dependency chain. Each unit operation feeds the next, and the chain cannot be parallelised. Power and utilities must come first: grid supply, steam generation, cooling water circulation. Then desalination; Iran struck a Bahrain desalination plant during the initial wave.26 A leaked US diplomatic cable warned that if Saudi Arabia’s Jubail desalination complex were damaged, Riyadh would need to be evacuated within a week.70 Then hydrogen production, because hydrotreaters cannot operate without it. Then the crude distillation unit, heated slowly to prevent thermal shock to furnace tubes and heat exchangers. Then vacuum distillation. Then the hydrotreaters themselves, with their sensitive catalyst beds. Then the catalytic crackers, the most delicate units, where heat balance and catalyst regeneration must be established gradually. Then product blending and testing. Then the ramp to nameplate capacity.
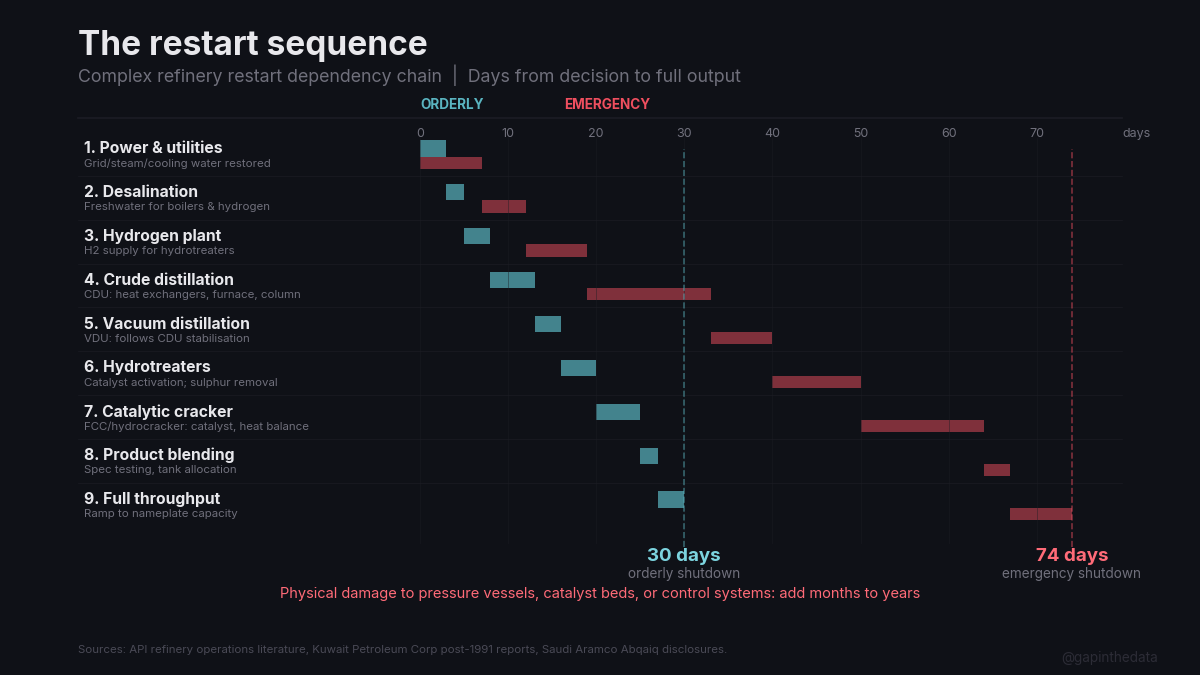
An orderly shutdown, where operators walk through the sequence in reverse, purging and preserving each unit, allows a restart in roughly 30 days.27 An emergency shutdown, where units trip and cool uncontrolled, extends the timeline to 60 to 75 days.28 Physical damage to pressure vessels, catalyst beds, or control systems adds months to years, because heavy-wall pressure vessels for refinery service carry 18 to 24 month lead times from the handful of specialist forges capable of producing them.29
The Kuwait precedent is instructive. After Iraq invaded in 1990, it sabotaged Kuwait’s refinery infrastructure on retreat. The Shuaiba refinery took 33 months to return to full capacity.30 The Mina Al-Ahmadi refinery took over two years. The bottleneck was downstream conversion units, where catalyst beds were contaminated and pressure vessels cracked from uncontrolled thermal cycling.
The Abqaiq precedent tells the opposite story. Saudi Aramco restored 5.7 million barrels per day in approximately two weeks after the 2019 drone and missile attack.31 The distinction: Aramco had built redundancy into Abqaiq, with spare processing trains. The damage was limited to stabilisation equipment, with no pressure vessels breached and no catalysts contaminated, under a stable government motivated to restore output.
Recovery speed depends less on damage than on whether the entity controlling the infrastructure is stable, technically capable, and motivated to restore output. Saudi Arabia in 2019 had all three. Kuwait in 1991 had the last two but required foreign assistance and time. Iran in 1979 had none, and production never returned to the Shah-era peak.
The Gulf refineries processing roughly 5.5 million barrels per day of crude into exportable products, including jet fuel, face a restart sequence measured in weeks under the best scenario and months under realistic ones.32 The forward curve, declining from $111 in May to $90 in August, implies a resolution timeline at or faster than even an orderly restart.35
IV. The price signal
Brent hit $119.50 in Asian trading on March 9 before pulling back to $103 on Macron’s “envisaged option” remarks.33 By March 10, Brent retreated further to the mid-$90s on Trump’s rhetoric about “taking over” oil-producing regions, a price move driven entirely by words against an unchanged physical shortfall.98 The forward curve is in steep backwardation, with the market pricing a disruption that eases but remains severe in the near term.35
The price response remains muted relative to the supply loss. The 1973 embargo quadrupled prices on 4.3 million barrels per day lost. The current disruption has removed at least as much and potentially more than twice as much supply, and prices have risen roughly 50%. The gap reflects a market pricing rapid resolution. If the market reprices toward a sustained disruption, even a partial one where 3 to 5 million barrels per day remain offline for months rather than weeks, Hamilton’s historical relationship between supply loss and price implies Brent above $130, and Rystad’s tail scenario puts it above $200.36 Goldman Sachs warned that Brent could hit $150 if the blockade persists through March.74
Broad transport demand destruction historically requires crude above $130.37 Aviation’s fuel costs have already reached crisis levels at current crude prices, well below that threshold.
US jet fuel crack spreads, the gap between crude and refined jet fuel, have blown out to $85 to $95 per barrel, meaning jet fuel is trading at nearly double the underlying crude price.90 Deutsche Bank’s Michael Linenberg called this an “existential threat” to carriers, noting the last comparable crack spread spike in 2005 drove Delta and Northwest into Chapter 11.91 Current crack spreads exceed the levels that preceded the 2005 airline bankruptcies.
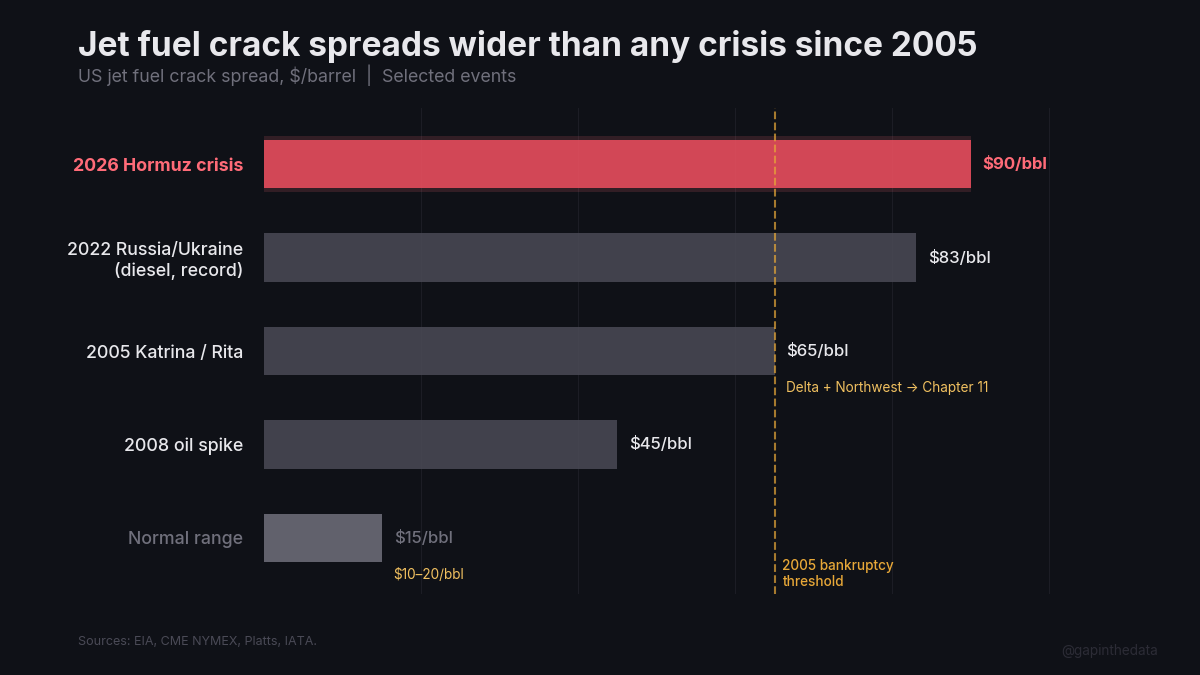
Jet fuel at the US Gulf Coast hit $4.12 per gallon on March 6 and $4.30 by March 7.39 Northwest European jet fuel hit $1,500 per tonne, up 80% from pre-strike levels.76 Globally, the IATA fuel monitor showed jet fuel at $157.41 per barrel, up 58% in a single week.40 At $110 crude, jet fuel trades near $138 to $160 per barrel, or roughly $3.30 to $3.80 per gallon. At $150 crude, the sustained-disruption scenario Goldman Sachs and Rystad have modelled, jet fuel approaches $4.50 to $5.20 per gallon, exceeding the 2008 peak of $4.36 that triggered 25 airline bankruptcies in the United States alone.41
V. Transmission to aviation
Fuel is the largest or second-largest operating cost for every airline. Full-service carriers run at 25 to 30% of operating expenses. Low-cost carriers, which optimise everything else, expose 30 to 35%.65
The margins documented in More Passengers, Less Profit were already compressing before the oil spike. SWISS’s operating margin fell from 13.5% to 9.1% in two years.66 Ryanair dropped from 15.3% to 11.2%.67 American Airlines operated at 2.7%.68 The cost ratchet of labour, maintenance, and infrastructure fees was already tightening the range between revenue and expense. Fuel compounds the pressure.
Each $10 per barrel increase in crude oil adds roughly 1.5 to 2 percentage points to fuel’s share of operating costs and subtracts 0.5 to 1.0 percentage points from operating margins, absent fare increases.42 The move from $78 to $110 represents a $32 increase, implying 2 to 3 percentage points of margin compression from fuel alone. At current fuel prices and absent offsetting fare increases, this arithmetic would compress American Airlines’ 2.7% margin to break-even or below and SWISS’s 9.1% margin toward 6%.
United Airlines CEO Scott Kirby said on March 5 that the fuel spike would have a “meaningful impact” on quarterly results and that “if fuel stays at these levels, ticket prices will probably start moving up pretty quickly."92 More than 21,000 flights were cancelled globally in the first week of March.93 American Airlines warned of a potential Q1 adjusted loss of up to $0.50 per share; its stock fell 15% in seven days.94 The S&P Airlines index entered a bear market, down 22% from its high.95
The standard assumption is that airlines hedge fuel costs. Many no longer do.
| Carrier | Hedged (2026) | Exposure |
|---|---|---|
| Delta | Minimal | Owns refinery (crude-exposed)48 |
| American | None | Fully exposed |
| United | None | |
| Southwest | None (ended 2025) | |
| Ryanair | 84% at $77/bbl | Hedges roll in 2027 |
| IAG | ~60% | |
| Lufthansa | 28% | Well below historical |
| Emirates | 0% (stated policy) | No hedging, ever |
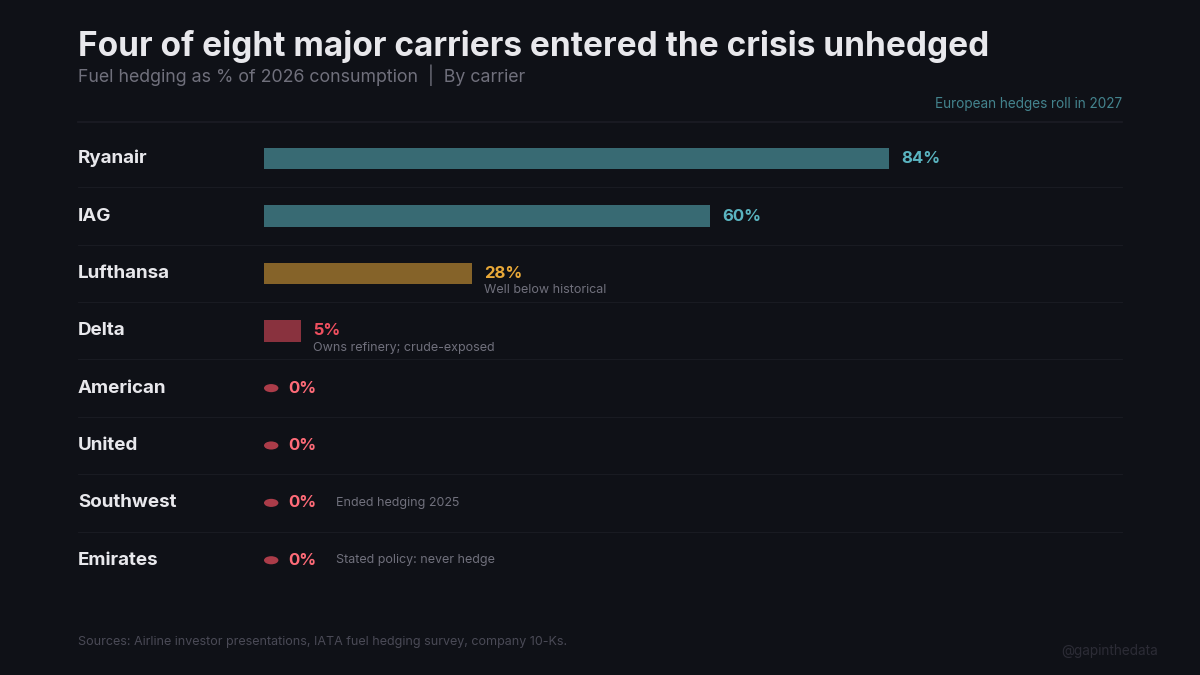
US carriers largely stopped hedging over the past two decades.43 44 45 Delta’s 10-K discloses fuel sensitivity at $40 million per penny per gallon; American’s at $50 million.46 47 At the roughly $2 per gallon increase in Gulf Coast jet fuel since February 5, the annualised cost impact on the four largest US carriers is measured in the tens of billions.69 European hedges are a timing cushion rather than a shield; an airline locked in at $80 through 2026 faces a $110+ rehedge in 2027.49 50 51 52
Beyond price, the supply chain is physically breaking. An estimated 25 to 50% of European jet fuel imports originate from the Gulf; Kuwait’s Al Zour refinery alone provides roughly 10% of Europe’s supply.79 India’s Reliance Jamnagar refinery, the natural replacement source, has redirected tankers away from Europe and toward Asia, where margins are higher. At least four vessels carrying jet fuel originally destined for European buyers made U-turns in early March.80 IATA warned on March 7 that Europe is “weeks away from flight cancellations or delays due to lack of jet fuel, rather than months."81
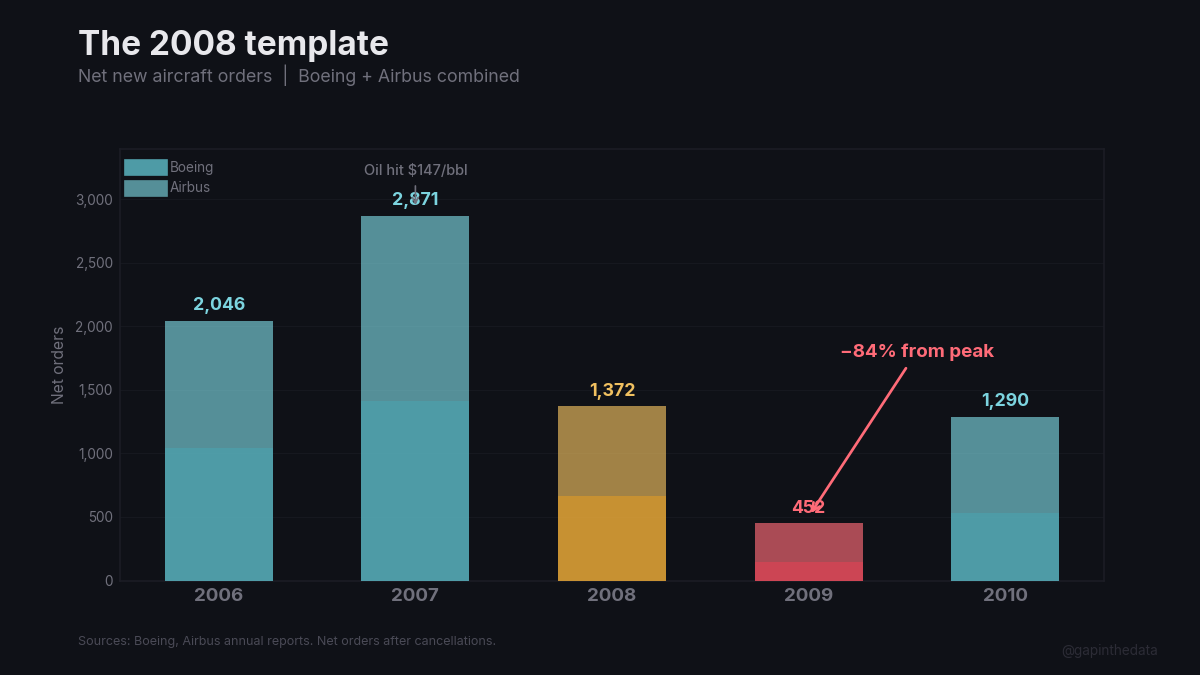
The closest historical precedent is the 2008 oil spike. Global airline capacity contracted 3 to 5% year-over-year.53 Boeing new orders fell 90%, from 1,413 to 142.54 Airbus new orders fell 79%, from 1,458 to 310.55 Route cancellations concentrated on long-haul, fuel-intensive flying, exactly the widebody segments that Gulf carriers dominate.56
TD Cowen revised United Airlines’ March-quarter earnings estimate to $0.05 to $0.22 per share at current fuel prices, down from United’s own January guidance of $1.00 to $1.50.75 Wizz Air has already flagged a $58 million profit impact from the current conflict.57
Each pressure documented in this series was independent before February 28. They are now simultaneous. The airline facing billions in additional fuel costs is the same airline whose new aircraft cost more to build, whose engines are grounded, whose airports were struck, whose margins were already falling. That is what correlation means.
Airlines in this position do three things: cut capacity, defer new aircraft, and conserve cash.58 In 2008, that sequence reduced Airbus new orders by 79%. The 870-delivery target does not require new orders; it requires existing customers to accept aircraft. In 2008 and 2020, customers in comparable positions pushed deliveries to later years.
The crisis continues to deepen. Iraq’s output has collapsed 70%; Kuwait declared force majeure on all exports; JPMorgan estimates Gulf storage fills within three weeks.59 71 99 72 The longer the Strait remains contested, the more production shuts in, and the closure operates as a gradient of risk that insurers and shipping companies must individually price.61 62 102 There is no clean resolution date for airlines to plan around.
Airbus needs roughly 83 deliveries per month for the rest of 2026 to reach 870.63 The previous record was 72. The customers who are supposed to accept those aircraft, airlines whose fuel bills just rose by billions, whose airports were struck, whose margins were already compressed, are the same customers who deferred in 2008 and again in 2020.
The G7 had the option of releasing 400 million barrels. They chose to “stand ready.” Energy Secretary Chris Wright said on March 8 that one tanker had passed through the Strait and called it “an early sign,” then added that worst case, normal traffic resumes “in a few weeks. That’s not months."60 Navy officials privately told tanker executives there is “presently no availability for an escort mission."100 On March 8, two vessels transited outbound, both Iranian-flagged. Zero inbound. Approximately 200 tankers remain stranded.101
Iran’s Foreign Minister Araghchi said on March 9 that Iran is “not asking for a ceasefire” and sees “no reason why we should negotiate."88 Trump demands unconditional surrender.
Four hundred million barrels at 2 million barrels per day of maximum release capacity lasts 200 days, covering 20% of a 10 million barrel per day shortfall for as long as the stockpile holds. But that is now a hypothetical. The buffer has not been deployed.64 The shortfall is not hypothetical.
Whether the futures curve is right, May $111 and August $90, depends on how quickly a decapitated Iranian government can agree to something it was not party to starting, how quickly G7 energy ministers can agree to something their finance ministers deferred, and whether either side will negotiate something both have publicly refused.
Footnotes
1 Bloomberg, “France Says G-7 Is Not There Yet on Releasing Oil Stockpiles,” March 9, 2026. French Finance Minister Roland Lescure, chairing the G7 finance ministers’ virtual meeting: “We are not there yet.” Also: “What we’ve agreed upon is to use any necessary tools, if need be, to stabilize the market, including the potential release of necessary stockpiles.” Decision deferred to G7 energy ministers’ meeting on Tuesday, March 11.
2 ICE Brent crude futures, March 9, 2026. Brent hit $119.50 intraday (Asian trading), pulled back to approximately $103 after Macron remarks. Pre-strike level (February 27): approximately $78/bbl. WTI weekly gain: 35.6%, largest since 1983. Brent weekly gain: 28%, largest since April 2020.
3 EIA, “The Strait of Hormuz Is the World’s Most Important Oil Transit Chokepoint,” updated 2024. Approximately 20M bbl/d of crude, condensate, and petroleum products.
4 Bloomberg, “IRGC Declares Hormuz Closed,” February 28, 2026. VHF radio warning: “No ship is allowed to pass.”
5 RegTechTimes, “Shipping Shock: Insurers Cancel Gulf Policies,” March 2026. Policies cancelled outright, not repriced.
6 EIA; Saudi Aramco East-West Pipeline (Petroline) disclosures. Nameplate: 5M bbl/d. Spare capacity: approximately 2.5-2.6M bbl/d. Built during the 1984-1988 Tanker War.
7 ADNOC, Habshan-Fujairah Pipeline disclosures. Capacity: 1.5M bbl/d. Routes Abu Dhabi crude to Fujairah on the Gulf of Oman.
8 EIA. All Qatari and UAE LNG exports transit Hormuz. No pipeline bypass exists for liquefied natural gas. Qatar declared force majeure on LNG deliveries: roughly 20% of global supply. European gas prices rose 52%. India’s GAIL cut gas supply to industrial consumers by 10-20%.
9 Hamilton, J.D. (2011), “Historical Oil Shocks,” NBER Working Paper. 1973 Arab embargo: 4.3M bbl/d production cut; price from $3 to $12 per barrel.
10 Hamilton (2011). Iranian revolution: 5.6M bbl/d lost; price from $14 to $38 per barrel.
11 Saudi Aramco press releases, September 2019. Abqaiq attack: 5.7M bbl/d knocked offline; production restored within approximately 2 weeks. Damage limited to stabilisation equipment; spare processing trains available.
12 Critical Threats (AEI/ISW), “Iran Update,” February 28, 2026. Supreme Leader Khamenei confirmed killed March 1 by Iranian state media. Chief of Staff Mousavi killed; IRGC Commander Pakpour likely killed.
13 Author analysis of historical oil disruption recovery timelines. Iran 1979: never recovered to Shah-era peak. Libya 2011: production still below pre-war levels in 2026. Iraq 2003: approximately 5 years to pre-war output, extended by insurgent sabotage.
14 DOE, SPR inventory data. Current holdings: approximately 395-415 million barrels.
15 DOE, “SPR Quick Facts.” Design maximum: 4.415M bbl/d across four sites. DOE Annual Report to Congress (2019): actual sustained capability reduced to approximately 4.22M bbl/d due to Bryan Mound cavern integrity issues. Sandia National Laboratories 2023 assessment confirmed ongoing cavern degradation.
16 EIA monthly SPR inventory data. June 2022: approximately 29.8 million barrels drawn, or approximately 993,000 bbl/d, the only month to approach the announced 1M bbl/d target.
17 EIA monthly SPR inventory data, April-October 2022. Average drawdown: approximately 780,000 bbl/d. Range: 575,000 bbl/d (October) to 993,000 bbl/d (June). Peak single week (ending September 9, 2022): approximately 8.4 million barrels, or 1.2M bbl/d.
18 DOE SPR site assessments. Bryan Mound and Bayou Choctaw have experienced cavern integrity issues limiting drawdown capacity. Big Hill and West Hackberry fully operational.
19 DOE, “SPR Drawdown Procedures.” Minimum 13 days from presidential order to first oil delivery to a refinery.
20 Japan JOGMEC (Japan Oil, Gas and Metals National Corporation) disclosures. Approximately 440 million barrels held across 10 government and private storage bases. Approximately 175 days of import coverage.
21 Germany’s Erdolbevorratungsverband (EBV) manages strategic reserves, substantially held as industry stocks in commercial storage.
22 Canada has no government-held strategic petroleum reserve. IEA compliance is met through industry-held stocks and domestic production.
23 UK BEIS (now DESNZ). No government-owned strategic stockpile. Industry-held stocks under the Compulsory Stocking Obligation meet IEA requirements.
24 EIA; market data. Brent crude declined from a peak of approximately $128/bbl (March 2022) to the $80-100 range over the subsequent months during the 180M barrel SPR release.
25 IEA. Russian oil supply disruption from sanctions: approximately 1-2M bbl/d reduction in exports.
26 Gulf state infrastructure interdependencies: desalination plants and refineries share power generation, steam systems, and water distribution infrastructure. A refinery restart requires the desalination chain to function first. Bahrain desalination plant strike: Al Jazeera, March 1, 2026.
27 API refinery operations literature; Kuwait Petroleum Corporation post-1991 reconstruction data. Orderly shutdown restart: approximately 30 days to full output for a complex refinery.
28 Same sources. Emergency shutdown restart: approximately 60-75 days, primarily due to catalyst reactivation and equipment inspection requirements.
29 Japan Steel Works, Sheffield Forgemasters, CNIM: the primary global forges for heavy-wall pressure vessels. Lead times: 18-24 months for refinery-grade pressure vessels.
30 Kuwait Petroleum Corporation post-1991 reports. Shuaiba refinery: 33 months to full capacity. Contributing factors: catalyst contamination, pressure vessel damage from uncontrolled thermal cycling, disrupted utilities infrastructure.
31 Saudi Aramco press releases, September 2019.
32 Author estimates from published refinery capacity data: Saudi Arabia (~1.8M bbl/d total capacity), Kuwait (~1.35M), UAE (~1.0M), Bahrain (~0.5M), Qatar (~0.14M), Iran (~2.2M). Total: approximately 7M bbl/d nameplate, with approximately 5.5M bbl/d in the Gulf states affected by the conflict.
33 ICE Brent crude futures. February 27: approximately $78/bbl. February 28: spike to approximately $117/bbl. Retreated to low $90s. March 9: hit $119.50 intraday before pulling back to $103 on Macron remarks. Israel struck Iranian oil infrastructure on March 8 (first time), triggering the second surge.
34 CNBC, March 6, 2026. US crude registered largest weekly gain in the history of the futures contract dating to 1983.
35 ICE Brent crude futures curve, March 9, 2026. May $110.93, June $102.51, July $95.16, August $90.10. Steep backwardation.
36 Hamilton (2011) and subsequent literature on the oil price-supply loss relationship. Historical average: 5-10% price increase per 1M bbl/d supply loss, with significant nonlinearity at large disruptions. Rystad Energy’s tail scenario, Strait closed and Saudi production fully shut, implies Brent above $200/bbl.
37 Dahl and Sterner (1991), “Analysing Gasoline Demand Elasticities,” Energy Economics. Short-run price elasticity: approximately -0.25. Long-run: approximately -0.6. The $130-150 threshold for significant OECD transport demand destruction is consensus across the literature.
38 IHS Markit / S&P Global Commodity Insights. Naphtha-to-ethane cost parity in petrochemical feedstock: approximately $100-110/bbl crude equivalent. Petrochemical demand destruction begins below the transport threshold but is not the primary channel for aviation impact.
39 S&P Global Platts, March 6, 2026. US Gulf Coast jet fuel spot: $4.12/gallon, highest since June 2022.
40 IATA Fuel Price Monitor. As of March 10: $157.41/barrel, up 58.4% week-over-week. Previous week: $99.40/barrel (already up 15% WoW). The velocity, from $99 to $157 in seven days, exceeds the 2008 spike rate.
41 Bureau of Transportation Statistics; DOT. 2008-2012: 25+ US airline bankruptcies including Frontier, Sun Country, Aloha, ATA, and Skybus. Jet fuel peaked at approximately $4.36/gallon in 2008.
42 Author calculation based on airline operating cost structures and fuel price sensitivity. Each $10/bbl crude increase ≈ 1.5-2pp increase in fuel share of opex ≈ 0.5-1.0pp margin compression, absent offsetting fare increases.
43 Reuters analysis, “US Airlines No Longer Hedge Fuel Costs,” March 6, 2026. US carriers largely stopped hedging over the past two decades.
44 Reuters (March 6, 2026). Southwest ended fuel hedging in 2025, calling it expensive and unreliable.
45 Delta, United, and American 10-K filings, FY2025. Minimal or no fuel hedge positions.
46 Delta Air Lines 10-K, FY2025. One-cent per gallon increase in jet fuel raises annual fuel expense by approximately $40 million.
47 American Airlines 10-K, FY2025. One-cent per gallon increase raises annual fuel expense by approximately $50 million.
48 Reuters (March 6, 2026). Delta subsidiary Monroe Energy operates a 190,000 bbl/d refinery in Trainer, Pennsylvania. Covers approximately 75% of Delta’s fuel consumption.
49 Ryanair investor presentations, FY2025. 84% of expected fuel consumption hedged for 2026 at approximately $77/bbl equivalent.
50 IAG Annual Report 2025: approximately 60% hedged. Lufthansa Group Annual Report 2025: only 28% hedged for 2026, significantly below historical levels.
51 Reuters (March 6, 2026). Air France-KLM and Cathay Pacific maintain active hedging books.
52 Emirates Group Annual Reports. Emirates maintains a stated policy of not using fuel hedging instruments.
53 IATA World Air Transport Statistics. Global airline ASK (Available Seat Kilometres) contracted approximately 3-5% year-over-year in 2008-2009.
54 Boeing Orders and Deliveries data. 2007: 1,413 net orders. 2009: 142 net orders. Decline: 90%.
55 Airbus Orders and Deliveries data. 2007: 1,458 net orders. 2009: 310 net orders. Decline: 79%.
56 Bureau of Transportation Statistics; DOT. 25+ US airline bankruptcies, 2008-2012.
57 AeroTime Hub, March 2026. Wizz Air flagged a $58 million profit impact from the Iran conflict.
58 IATA, “Airline Industry Economic Performance” series. Standard airline response to oil shock: capacity reduction → deferral of capital expenditure → cash preservation.
59 Reuters; Al Jazeera, March 8, 2026. Iraq, UAE, and Kuwait cutting oil production as Gulf storage fills with nowhere to export. Oilfields producing into full storage must reduce output or risk damaging reservoir pressure.
60 Washington Times, March 8, 2026. Energy Secretary Chris Wright said an oil tanker has passed through the Strait of Hormuz, calling it “an early sign” the route is reopening.
61 US government announcements, March 2026. Naval escorts for tankers pledged; US Development Finance Corporation (DFC) and Treasury announced a $20 billion reinsurance facility for Gulf shipping. Marsh McLennan’s Ben Black called it “unprecedented in peacetime.” Shipowners responded that the binding constraint is crew safety, not insurance cost; no premium compensates a crew for transiting an active combat zone.
62 Xinhua, March 7, 2026. Iran denied reports of closing Hormuz. Al Jazeera, March 4, 2026: IRGC struck a tanker with a drone after it ignored warnings. Contradictory signals.
63 Airbus SE, FY2025 press release and January-February 2026 delivery data. Through February, Airbus delivered approximately 52 aircraft, roughly 20% behind the equivalent 2025 pace. 870 minus ~52 = ~818 remaining over 10 months = ~82/month. The all-time monthly average record was 71.9 (2019: 863 aircraft / 12 months). See What Safran Can’t Fix.
64 ICE Brent crude futures curve, March 9, 2026. The futures curve is a price at which buyers and sellers are willing to transact, not a prediction of where spot will be.
65 IATA; airline annual reports. Fuel as % of operating expenses: full-service 25-30%, LCC 30-35%, Gulf carriers 30-35%. Varies by fuel price and hedging position.
66 SWISS FY2025 results. Operating margin: 9.1% (FY2025) vs 13.5% (FY2023). See More Passengers, Less Profit.
67 Ryanair FY2025 (year ending March 2025). Operating margin: 11.2% vs 15.3% prior year. See More Passengers, Less Profit.
68 American Airlines 10-K, FY2025. Operating margin: 2.7%.
69 Author calculation from 10-K fuel sensitivity disclosures. Gulf Coast jet fuel rose from $2.24/gal (Feb 5) to $4.30/gal (March 7), a $2.06/gal increase. At disclosed sensitivities (Delta: $40M/cent; American: $50M/cent) the annualised impact for those two carriers alone exceeds $18 billion. The actual impact depends on contract structures, consumption patterns, and how long prices remain elevated; a crude-oil-equivalent calculation yields lower figures because part of the jet fuel increase reflects crack spread widening rather than crude price movement.
70 WikiLeaks, US Embassy Riyadh cable 09RIYADH651, “Saudi Water Vulnerability.” The Jubail complex provides approximately 50% of Riyadh’s potable water via a 450-km pipeline. Iran struck a Bahrain desalination plant during the February 28 strikes, demonstrating both capability and intent to target water infrastructure.
71 Reuters, March 8, 2026. Iraq’s oil production collapsed from ~4.1M to approximately 1.3M bbl/d as southern Basra export terminals, which handle ~90% of Iraqi exports, have no route to market with the Strait closed. Northern Kirkuk-Ceyhan pipeline operates at reduced capacity.
72 JPMorgan, “Gulf Oil Storage Capacity Note,” March 7, 2026. Estimated Gulf on-shore crude storage capacity utilisation at ~85% as of March 6. At current shut-in rates, full storage in approximately 3 weeks, forcing further production curtailment.
73 Euronews; Bloomberg; Jerusalem Post, March 2, 2026. Two Iranian drones targeted Ras Tanura; Saudi Defence Ministry claimed both intercepted, but debris caused a fire. Aramco shut the entire 550,000 bbl/d complex. Satellite imagery (Vantor) shows burn scars and structural damage. Aramco stated the shutdown would last “a few weeks.” Saudi officials said it affects 30-33% of domestic refining.
74 Goldman Sachs (Daan Struyven, Head of Oil Research). Revised Q2 base case: Brent $76 (from $66). If Hormuz remains depressed through March: $150. “We now also think it’s likely that oil prices, especially for refined products, would exceed the 2008 and 2022 peaks, if Strait of Hormuz flows were to remain depressed throughout March.” Goldman frames the disruption as “a shock 17 times larger than the peak impact from Russia’s 2022 invasion.” Geopolitical risk premium: ~$13/bbl; fair value without disruptions: ~$65/bbl. Note: Goldman’s $76 base case assumed “temporary disruption with partial diplomatic progress”; by March 10, Brent had already traded above $76 for twelve consecutive sessions. CNBC, citing Rapidan Energy, calls it “the biggest oil supply disruption in history”: 20% of global supply offline for 9+ days.
75 TD Cowen, analyst note, March 6, 2026. United Airlines Q1 2026 EPS estimate revised to $0.05-0.22 at current jet fuel prices, down from United’s own January 2026 guidance of $1.00-1.50/share.
76 S&P Global Platts; Argus Media, March 7, 2026. Northwest European jet fuel (CIF NWE): approximately $1,500/tonne, up ~80% from pre-strike levels of ~$830/tonne.
77 IEA; EIA; OPEC monthly reports. Saudi Arabia’s claimed 12M bbl/d capacity ceiling has never been tested in production. Non-Gulf OPEC spare capacity: Nigeria ~700K bbl/d below quota (pipeline theft, infrastructure decay); Angola below former quota (field decline, left OPEC 2024); Libya politically fragmented; Venezuela production fell 210K bbl/d in January 2026 to 780K bbl/d.
78 CNBC; Fortune, March 1, 2026. OPEC+ agreed to raise output by 206,000 bbl/d starting April 2026. Against a 6-10M bbl/d shortfall, this covers approximately 2-3%.
79 Energy Intelligence; FGE NexantECA. European jet fuel Gulf dependency estimated at 25-50% of imports. Kuwait’s Al Zour refinery alone provides approximately 10% of Europe’s jet fuel imports.
80 Business Standard; SCMP, March 6-10, 2026. At least four tankers carrying Reliance Jamnagar diesel and jet fuel, initially destined for European buyers, made U-turns and diverted to Southeast Asia where refining margins were higher. Singapore jet fuel margins hit $80/barrel on March 5, incentivising every Asian-refined barrel to stay in Asia.
81 IATA, “Middle East Conflict Exposes Jet Fuel Supply Vulnerabilities,” March 7, 2026. “We’re weeks away from maybe flight cancellations or delays due to lack of jet fuel, rather than months.”
82 Fortune, March 9, 2026. Macron: “The use of strategic reserves is an envisaged option.” Oil pulled back from $119 to $103 on the remarks. G7 leaders could meet “this week” to coordinate.
83 Anadolu Agency, March 4, 2026. Oil flows via Strait of Hormuz plunged 86%. On March 1, only 3 tankers carrying 2.8 million barrels transited, vs. the 2026 average of 19.8M bbl/day. By March 4, 5 vessel crossings vs. 7-day average of 27.
84 Al Jazeera; TIME; Axios, March 8, 2026. Israel struck Shahr-e Rey refinery complex (one of Iran’s largest), Aghdasieh oil warehouse, Shahran oil depot, and Fardis oil depot in Karaj. Massive fires; toxic black smoke over Tehran (population 10 million). Iranian Red Crescent warned of “high concentrations of toxic hydrocarbons.” Axios: strikes “went far beyond what the U.S. expected,” sparking the first significant US-Israel disagreement since the war began. IRGC retaliated by striking Israel’s Haifa refinery.
85 G7 Finance Ministers Joint Communiqué, March 9, 2026. “We stand ready to take necessary measures, including to support global supply of energy such as stockpile release.” Decision on action deferred to G7 energy ministers’ meeting on Tuesday, March 11. Per FT: a US official said there were “grounds for optimism that action could be taken soon after.”
86 IEA Executive Director Fatih Birol, Brussels press conference, March 6, 2026. “All options are on the table, but there are no plans for a collective action at this stage.” Also: “There is plenty of oil, we have no oil shortage. There is a huge surplus in the market.” Argus Media.
87 IEA statement, March 9, 2026. Birol at G7 finance ministers’ meeting: “Challenges to transit through the Strait of Hormuz and curtailments in oil production are posing significant and growing risks to global oil markets.” Tone shifted markedly from March 6.
88 Iran Foreign Minister Abbas Araghchi, March 9, 2026 (Al Jazeera; Reuters). “We are not asking for a ceasefire.” “We don’t see any reason why we should negotiate.” President Trump, same day: demanded “unconditional surrender.” Neither side has proposed terms. The futures curve prices a resolution that neither party is pursuing.
89 Deutsche Bank (Michael Linenberg), March 7, 2026, via ZeroHedge. Gulf Coast jet fuel closed at $4.30/gallon vs. $2.24 on February 5, a near-doubling. Jet fuel year-to-date surge: 100-125%.
90 Deutsche Bank (Michael Linenberg), March 7, 2026. “US jet fuel crack spreads for Gulf Coast, New York Harbor, and West Coast now range from $85 to $95 per barrel.” Diesel crack spread: ~$64/bbl (record was $83 in October 2022).
91 Deutsche Bank (Michael Linenberg), March 7, 2026. “Airlines around the world could be forced to ground thousands of aircraft while some of the industry’s financially weakest carriers could halt operations.” Called the oil spike an “existential threat” to carriers. “The last time we witnessed this phenomenon was in 2005 when crack spreads of as high as $65 per barrel exceeded ~$60 per barrel oil prices in the aftermath of Hurricanes Katrina and Rita. The damage to the airline industry was significant and widespread including major airlines Delta and Northwest filing for Chapter 11 bankruptcy in September 2005.”
92 CNBC, March 6, 2026. United Airlines CEO Scott Kirby (Harvard SEAS, March 5): “If it continues we’ll feel it in Q2 also. And if fuel stays at these levels, ticket prices will probably start moving up pretty quickly.” Also: “No one hedges anymore and even if you do, hedging the crack spread is really hard to do.”
93 The Traveler; Travel and Tour World, March 2026. More than 21,300 flights cancelled globally in the first week of March. 37,000+ flights to/from the Middle East cancelled Feb 28 – March 8.
94 Gulf News; Financial Content, March 2026. American Airlines suspended Philadelphia-Doha indefinitely (through at least June 22). Warned of potential Q1 adjusted loss up to ($0.50)/share. AAL stock fell ~15% in 7 days. Rothschild & Co. Redburn downgraded to neutral, forecasting losses for 2026.
95 Bloomberg via Yahoo Finance, March 2026. S&P Supercomposite Airlines Industry Index down 22%+ from its multi-year high, officially a bear market. The S&P 500 Passenger Airlines sub-index declined 12.6% week-over-week.
96 Lloyd’s List; TradeWinds, March 5-9, 2026. Gard, Skuld, and NorthStandard, three of the largest P&I clubs, withdrew war risk cover for Persian Gulf transits effective March 5. War risk premiums from remaining underwriters rose to approximately 1% of vessel value (vs. 0.01-0.05% pre-crisis). Approximately 1,000 vessels anchored or sheltering outside the Gulf as of March 9, per Kpler vessel tracking.
97 Argus Media; Kpler, March 9, 2026. Yanbu export terminal loadings averaged approximately 2.5M bbl/d in the first week of March, up from 786,000 bbl/d in February. The East-West Pipeline’s spare capacity was effectively exhausted within days of the Strait closure.
98 Reuters; CNBC, March 10, 2026. Brent crude retreated to the mid-$90s on March 10 after Trump’s comments about “taking over” oil-producing regions and assurances of plentiful US supply. No physical supply change accompanied the price move. The pattern, rhetoric-driven pullbacks against unchanged physical shortfalls, has repeated at each political intervention since February 28.
99 Kuwait Petroleum Corporation, March 9, 2026 (via Reuters). KPC declared force majeure on all crude oil and refined product export contracts. Kuwait’s three refineries (Mina Al-Ahmadi, Mina Abdullah, Al Zour) have a combined capacity of 1.35M bbl/d but no export route.
100 Financial Times; Reuters, March 9, 2026. US Navy officials privately told tanker company executives there is “presently no availability for an escort mission” through the Strait of Hormuz. The Fifth Fleet’s current posture prioritises force protection over commerce escort.
101 MarineTraffic; Kpler vessel tracking, March 8-9, 2026. Only 2 outbound transits on March 8, both Iranian-flagged vessels. Zero inbound commercial transits. Approximately 200 laden tankers stranded outside the Gulf awaiting safe passage or redirection orders.
102 Reuters; SCMP, March 8-9, 2026. Chinese-owned and Chinese-chartered vessels have been permitted selective transit. Iranian authorities have also reportedly allowed “Muslim nation” flagged vessels passage under escort. The blockade functions as geopolitical sorting, not a binary closure, which complicates both diplomatic framing and insurance assessment.
103 Kpler; Vortexa, March 2026. China holds an estimated 1.2 billion barrels in strategic and commercial petroleum reserves, approximately 108-130 days of import cover at current consumption rates. This strategic buffer, the largest outside the US SPR system, partly explains Beijing’s muted diplomatic response to the Strait closure.
Disclosure
This article is analytical commentary based on publicly available sources cited in the footnotes above. It does not constitute a personal recommendation, investment advice, or an inducement to buy or sell any financial instrument. Forward-looking assessments, including conditional price scenarios and margin projections, represent the author’s arithmetic from disclosed data and third-party estimates (Goldman Sachs, Rystad, Hamilton, Deutsche Bank, TD Cowen, IATA) and should not be construed as forecasts or price targets. Key assumptions are stated alongside each calculation.
Residual Research and its contributors hold no positions in the securities, commodities, or derivatives discussed in this article at the time of publication. No compensation has been received from any entity discussed. No article has been reviewed or approved by any issuer prior to publication.
Produced in compliance with Regulation (EU) No 596/2014 (Market Abuse Regulation) and Commission Delegated Regulation (EU) 2016/958. See the full Disclaimer for further regulatory information.